
Real-Time Monitoring
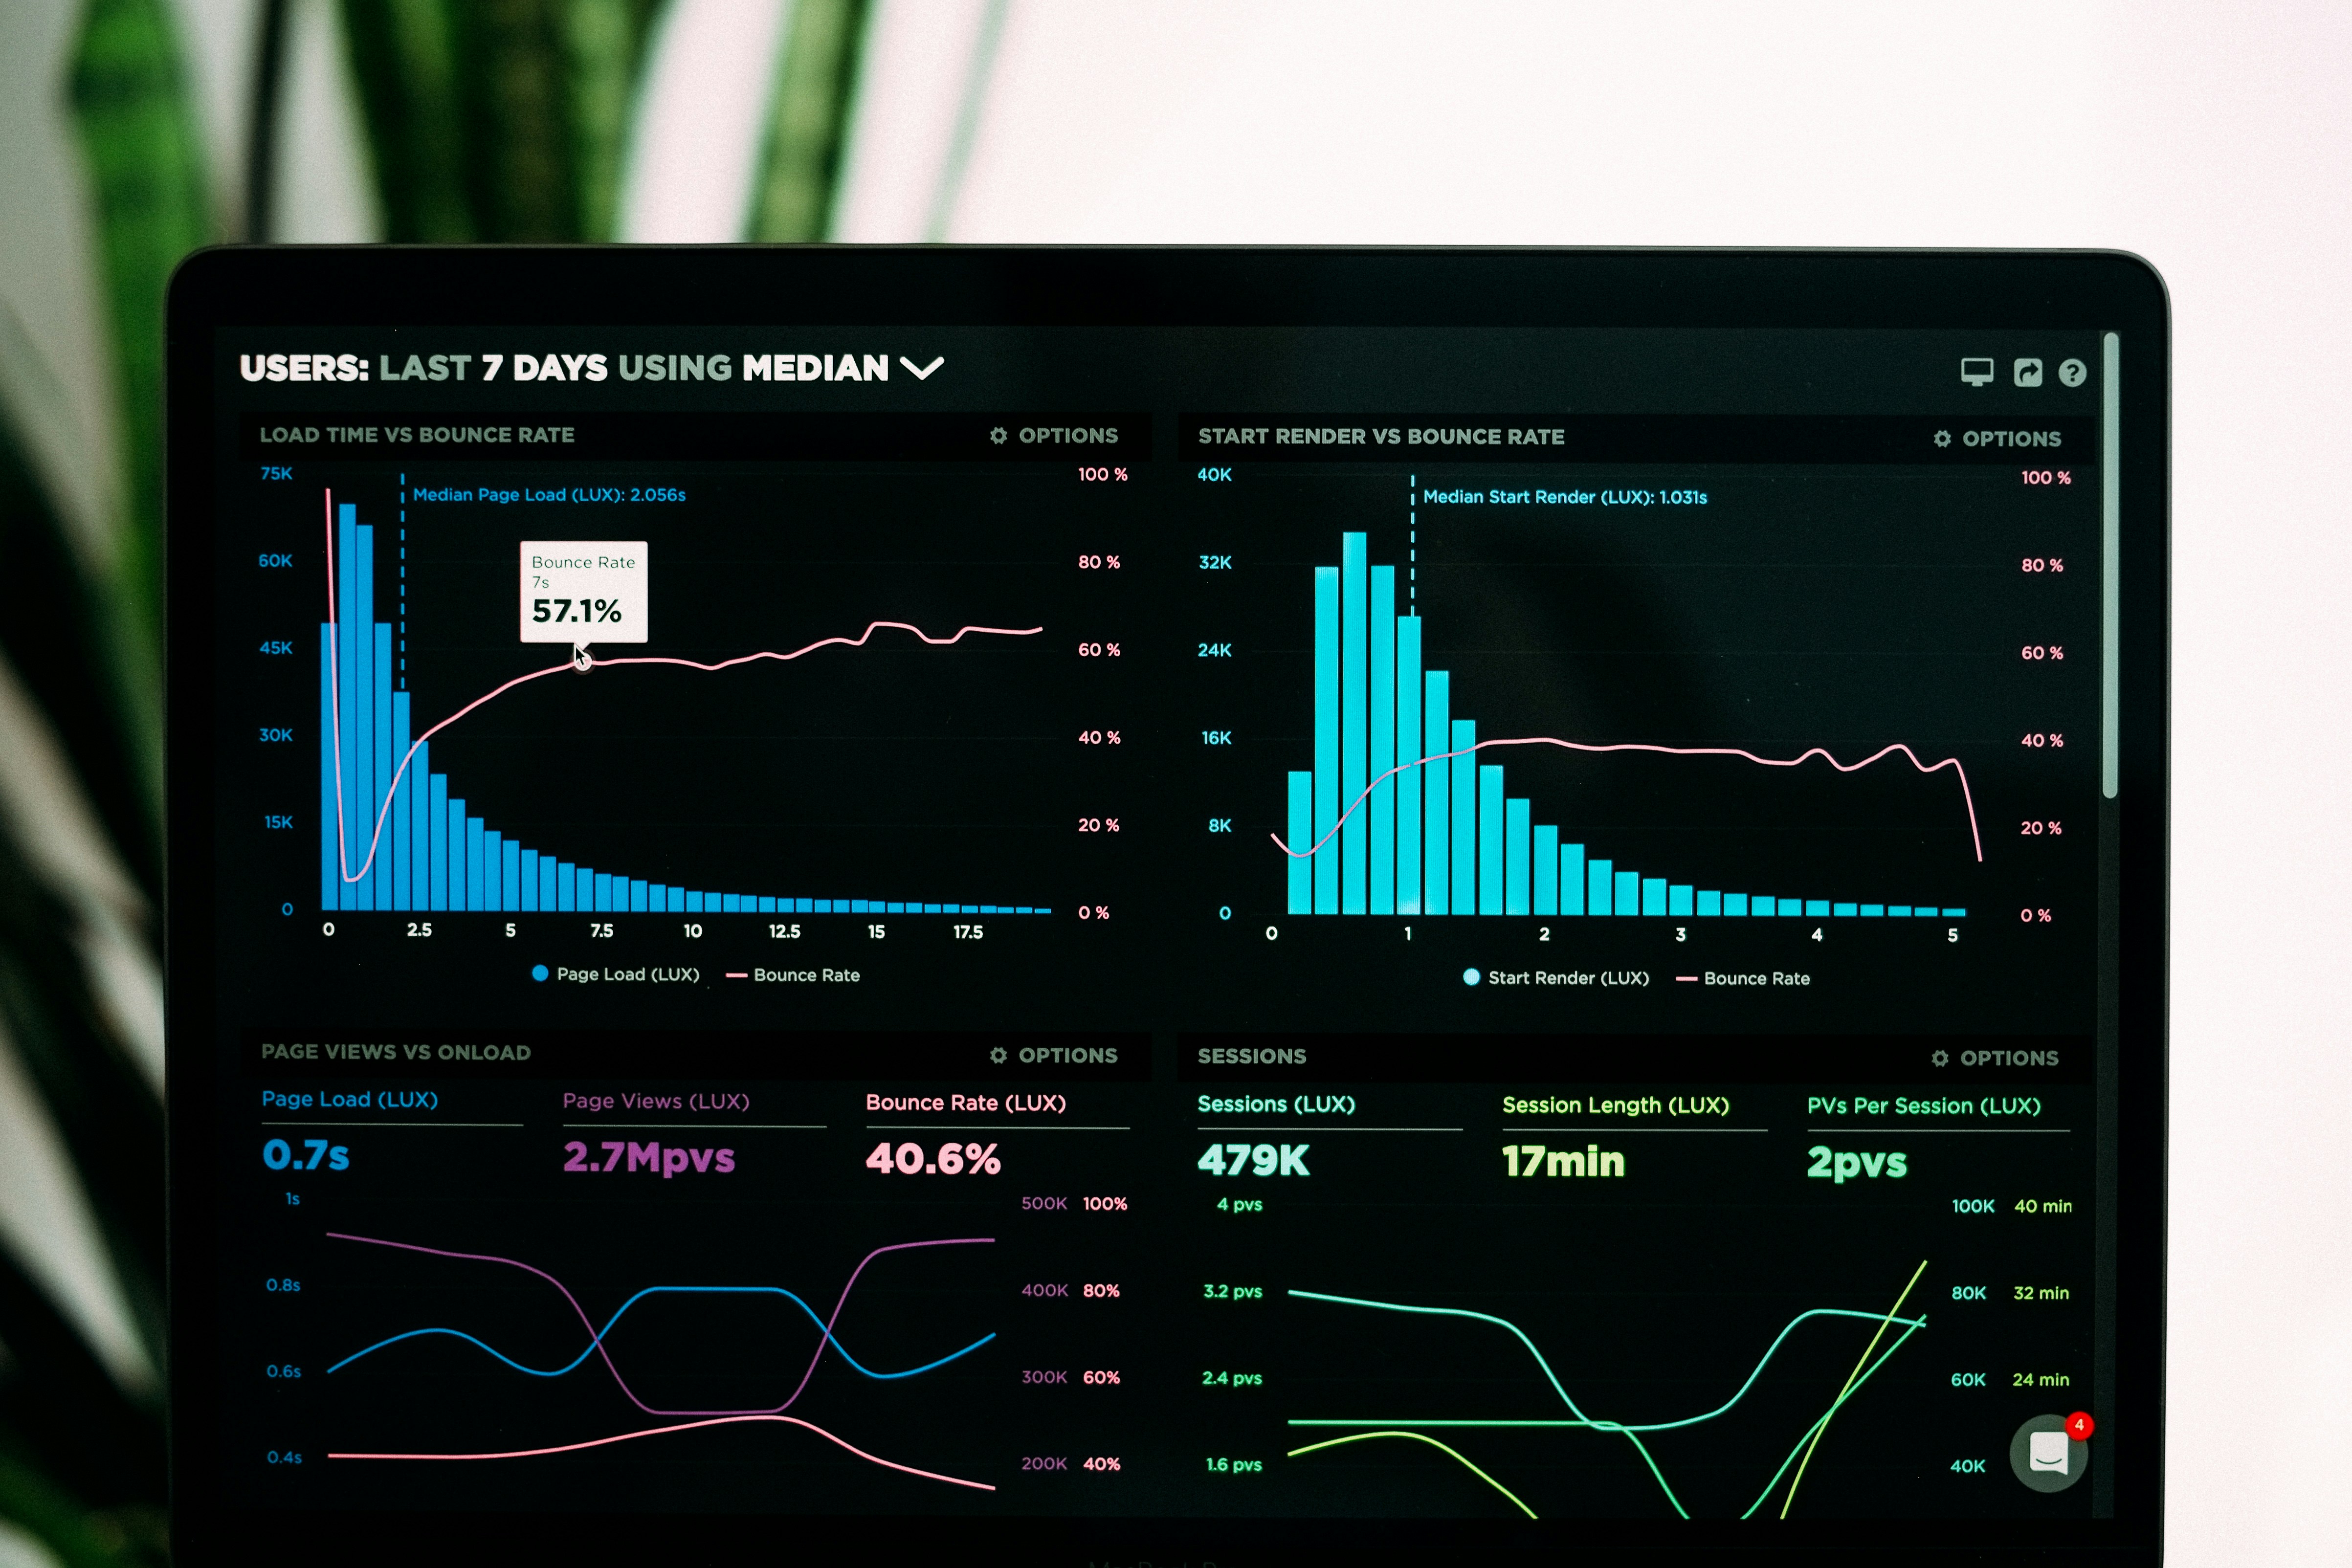
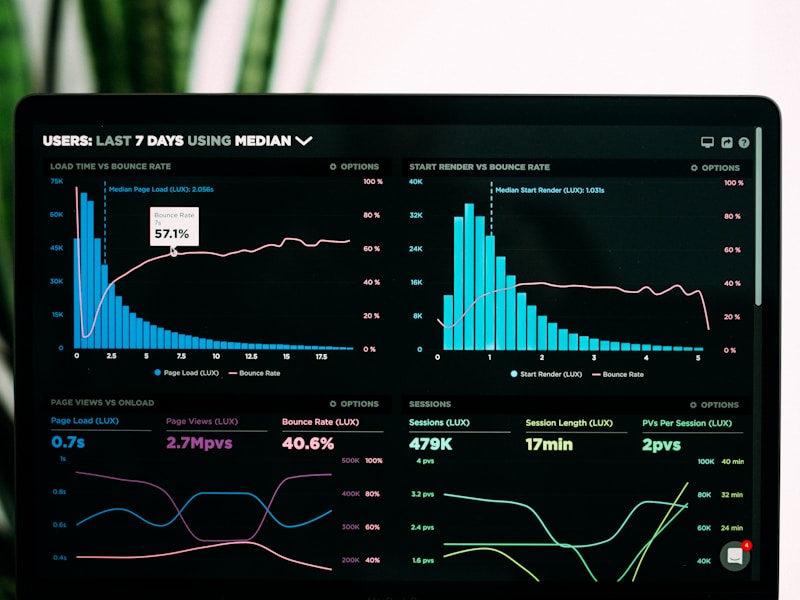
Track database performance, query execution, and system health with live-updating dashboards that refresh automatically.
Analytics Platform
Transform complex database queries into beautiful, interactive dashboards. Monitor performance, track metrics, and make data-driven decisions faster.
Write SQL queries and see results instantly transformed into interactive charts, graphs, and tables. Our intelligent visualization engine automatically suggests the best chart type for your data, while giving you full control to customize every detail.
Share dashboards with your team, add comments directly on charts, and set up alerts for key metrics. Everyone stays in sync with automatic refresh intervals and real-time collaboration features that make data exploration a team sport.
Track query performance, connection pools, and database health metrics in one unified view. Set custom thresholds, receive intelligent alerts, and drill down into slow queries with our built-in query analyzer to optimize your database performance.
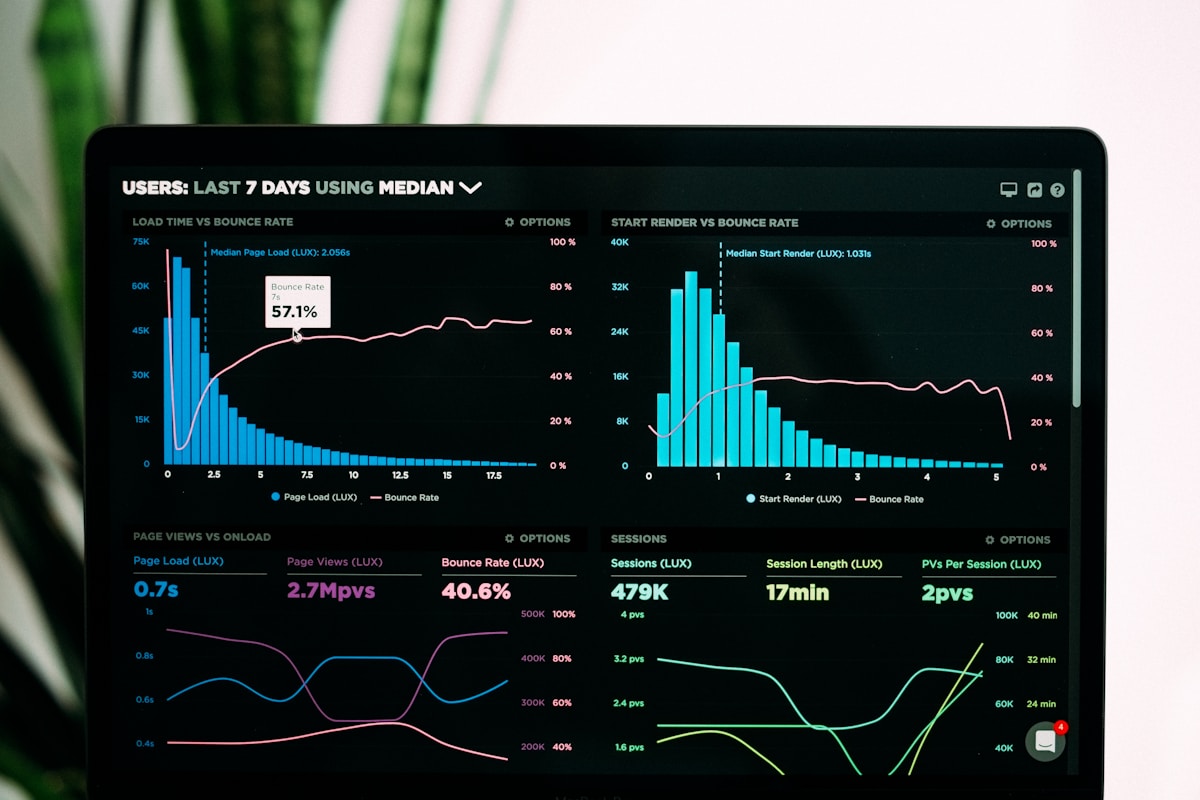
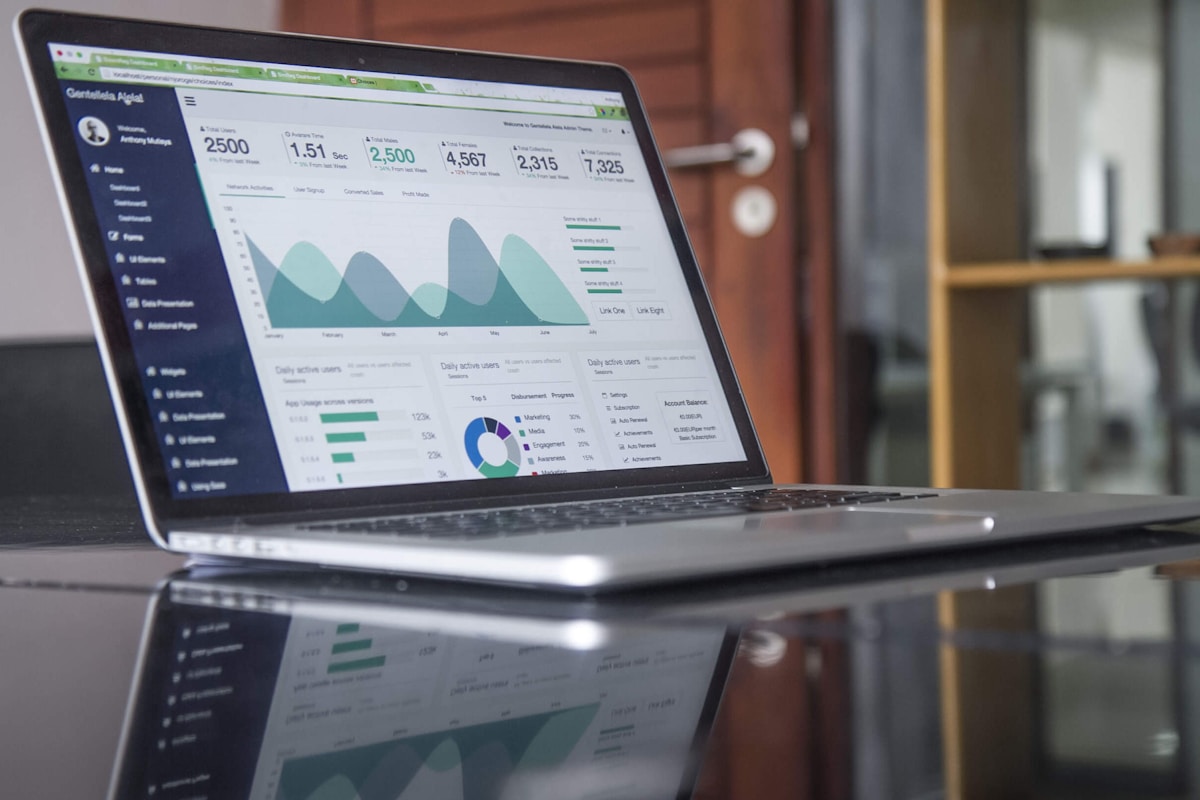

See how Postgres Dashboard transforms raw data into actionable insights in minutes, not hours.
From quick queries to complex analytics, see how teams use Postgres Dashboard to unlock insights.
Track database performance, query execution, and system health with live-updating dashboards that refresh automatically.
Build charts, graphs, and tables tailored to your data. Drag-and-drop interface makes it easy to create exactly what you need.
Share dashboards with your team, add comments, and collaborate on insights without leaving the platform.
Write complex queries with autocomplete, syntax highlighting, and query history. Execute and visualize results instantly.
Real workflows from teams using Postgres Dashboard to turn data into decisions every day.
Build 15 executive reports before Monday's board meeting
Reusable dashboard templates cut report creation time from 2 days to 3 hours
Monitor database performance across 50 microservices
Real-time alerts catch slow queries before customers notice; downtime reduced 90%
Track feature adoption and user behavior across releases
Custom cohort dashboards reveal which features drive retention; roadmap decisions backed by data
Reconcile revenue data from 8 different systems daily
Unified dashboard surfaces discrepancies instantly; month-end close now takes 3 days instead of 10
Measure campaign ROI and attribution across channels
Live conversion dashboards show what's working in real-time; budget reallocation happens same-day
Identify patterns in 500+ daily support tickets
Automated ticket analysis dashboard flags recurring issues; proactive fixes reduce volume 35%
Keep pipeline forecasts accurate across 40-person team
Shared dashboards sync with CRM; forecast accuracy improved from 65% to 92%
Balance team velocity with technical debt across sprints
Sprint dashboards visualize story points, bug trends, and deployment frequency in one view
Postgres Dashboard transformed how we analyze our data. What used to take hours of manual SQL queries now takes seconds with beautiful visualizations that our entire team can understand.

The real-time dashboards have been a game-changer for our operations team. We can spot issues immediately and make data-driven decisions faster than ever before.

Setting up complex queries used to be intimidating for our non-technical team members. Now everyone can explore our Postgres data independently and build their own dashboards.

We've tried several dashboard tools, but Postgres Dashboard's performance with large datasets is unmatched. Our queries run smoothly even with millions of rows.

The ability to share interactive dashboards with stakeholders has improved our reporting process dramatically. No more static screenshots or outdated spreadsheets.

Postgres Dashboard transformed how we monitor our database performance. What used to take hours of manual querying now happens in real-time with beautiful visualizations that everyone on the team can understand.

Shopwave

CloudSync

FinTrust

MediCare Portal

EduTrack

RetailHub
DataFlow

SecureBank
Join thousands of data teams who have transformed their Postgres databases into powerful, interactive dashboards. Get up and running in minutes with our intuitive interface, real-time updates, and seamless integrations. No credit card required to start your free trial.